How to Run a Sales Distribution Matrix (Gold Suppliers)
This report is great for a more granular report, compared to a Sales Report. A Sales Distribution Matrix combines the data selected in your Rows and your Columns to calculate your selected measures.
Below are the steps to run a Sales Distribution Matrix:
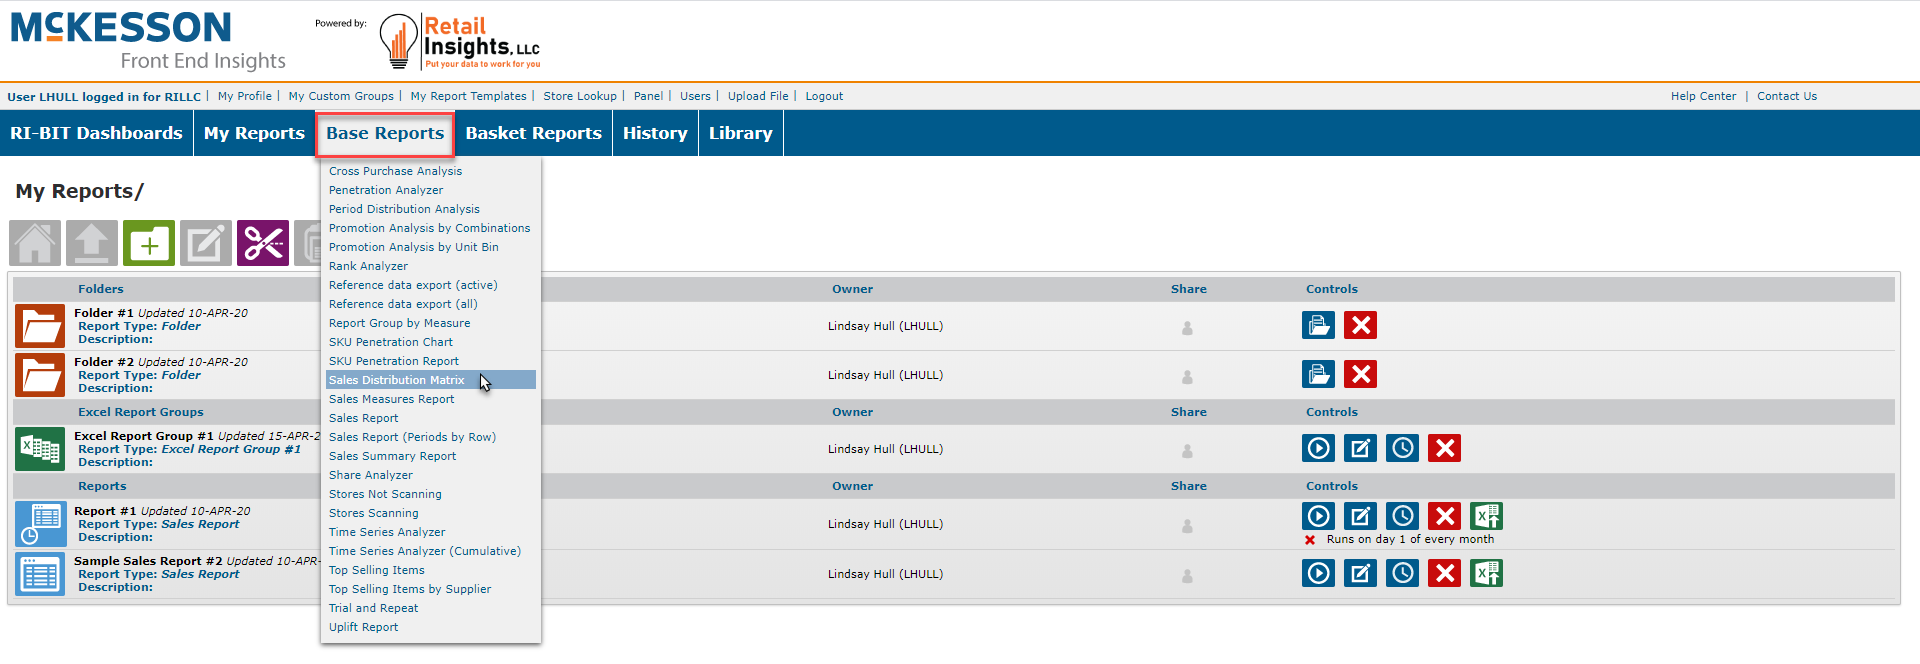
- From the My Reports page (or any page), hover over the Base Reports tab and select 'Sales Distribution Matrix'.
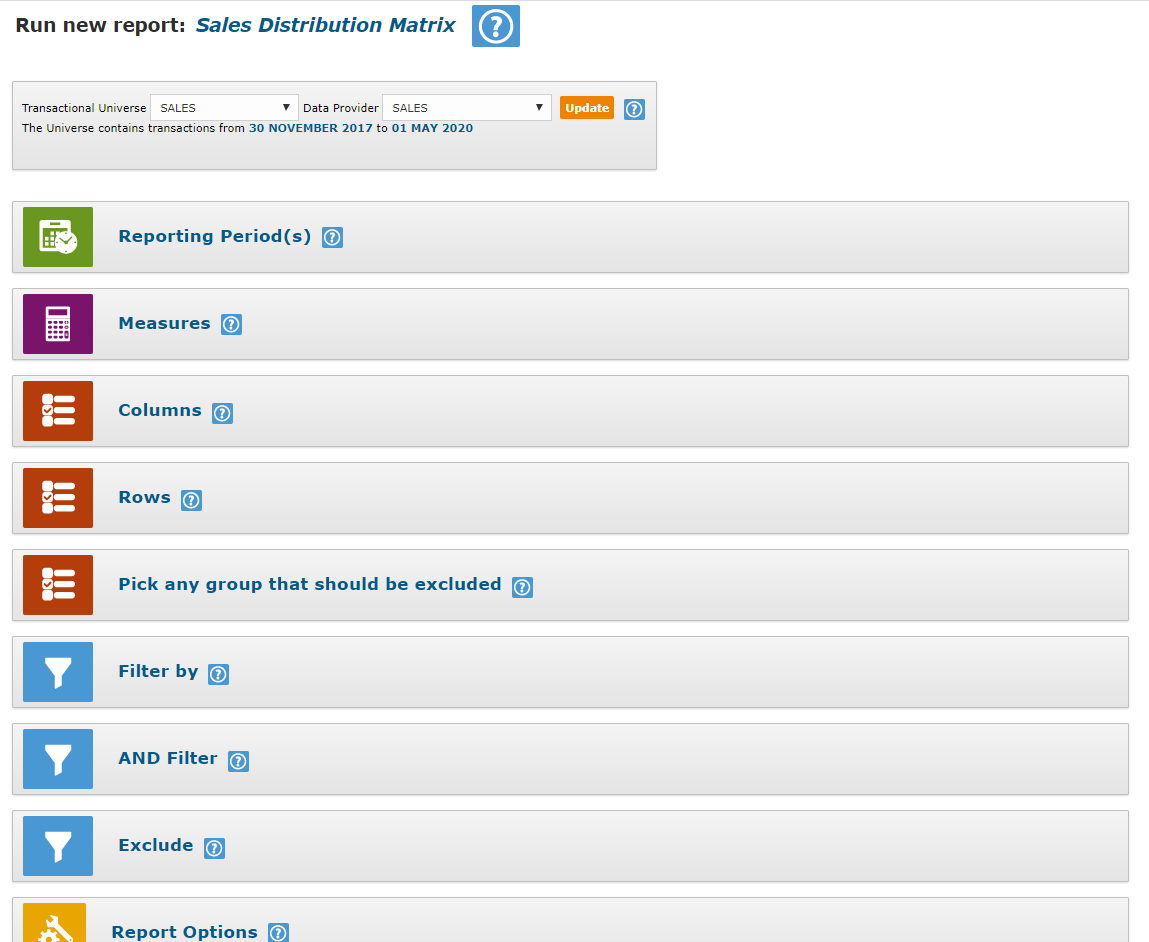
This will bring you to your Sales Distribution Matrix page:
2. Select the Transactional Universe you would like to use for your report. The Data Provider field will automatically update once you've selected your Transactional Universe. Your options are:
- Sales
- Scan
- Inventory
- Purchase Order
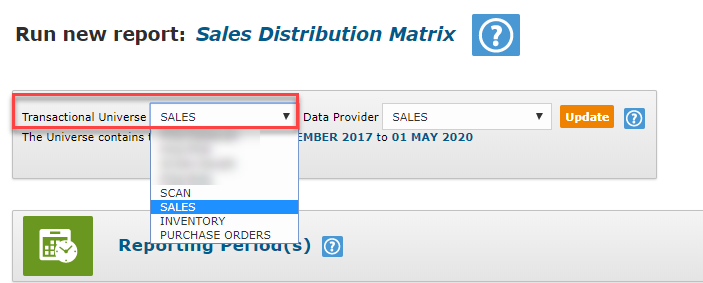
3. Once you have selected your Universe, click Update. This will update your pickers.
Selecting Your Pickers:
4. Reporting Period(s) - Here you will select the timeframe you would like your data to run from. First, select the timeframe range in the Select By section:
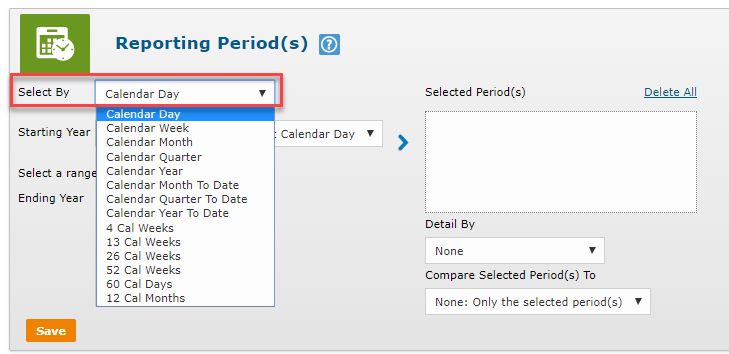
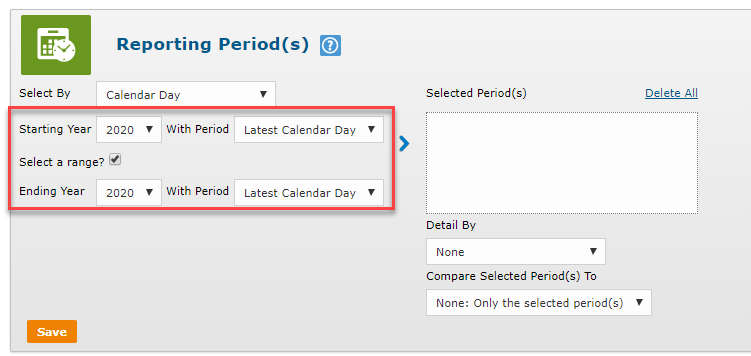
Then, you will select the Year and Period you want to view. You also have the option to select a specific range. You can do this by clicking the 'Select a Range' checkbox. This will allow the Ending Year and Period to appear.
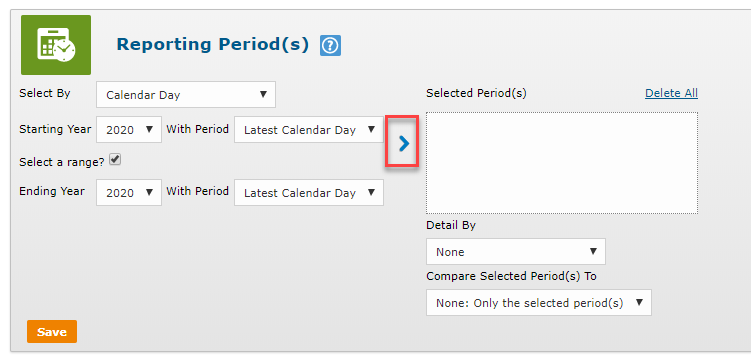
Once you have determined the timeframe, click the right arrow button to move your selection to the 'Selected Period(s)' column on the right column of your picker.
The Detail By dropdown allows you to include a more detailed timeframe in your report. For example, if you have selected the Latest Month as your timeframe and you have selected Detail By Week, your report will contain a different column of data for each week in the latest month. If you leave this section blank, your report will only contain data from the latest month as a total.
Compare Selected Period(s) To allows you to compare your selected timeframe to the previous year, or the previous period. For example, if you have selected the Latest Month (May 2020) as your timeframe and you want to compare your data with the previous month, you will select Period on Period. If you want to compare to the previous year, you will select Year on Year.
Example Reporting Period(s) Picker:
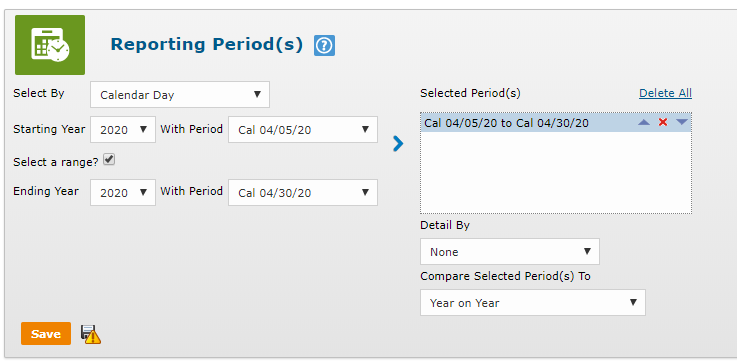
In the screenshot above, I want to run my report from April 5, 2020 to April 30, 2020. I selected to run my report by Calendar Day and was then able to enter my start date. Next, I checked the 'Select a Range' box to allow me to enter an end date. Once I entered my desired timeframe, I clicked the arrow to move my selected dates to the 'Selected Period(s)' column. I also want to compare my data to the same time last year, so I clicked Year on Year in the 'Compare Selected Period(s) To' dropdown.
5. Measures - All available measures for your report will be located in the left column. Click on any measure to move the measure to the Selected Measure(s) column. This will add the section to your report. Each measure selected will be a different column of data in your report.
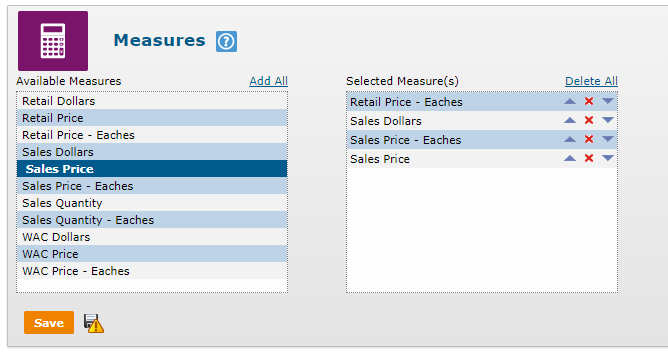
In the screenshot above, I have added Retail Price - Eaches, Sales Dollars, Sales Price - Eaches, and Sales Price to my report.
To change the placement of any measure, click the up and down arrows next to each measure. To remove a measure, click the 'X' icon next to the measure.
6. Columns - This picker allows you to select what columns you would like to appear in your report.
First, you will need to select the Class for your report. This will provide you with various entities to select from.
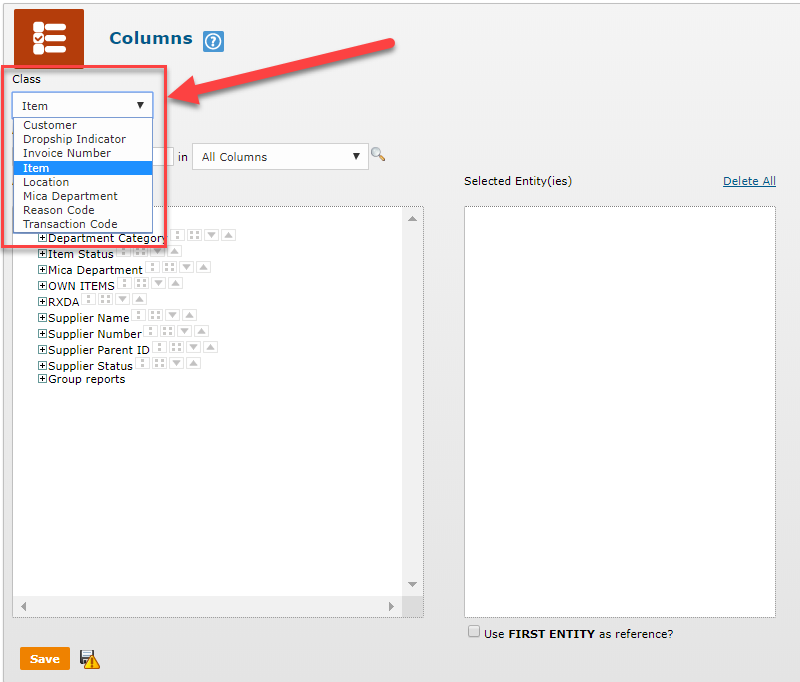
Next, you will select the 'Available Entities' you would like in your report. Click any + sign to expand your entity search. You may also use the search bar below the 'Class' field to search for a specific field. When selecting your entity, you will have five different options for each entity available.
- You can select the entity itself by clicking on the entity name, like the category Analgesics. This will rollup all the data for the Analgesics category into one column.
- Clicking the two dots next to an entity will allow you to select an entity to the Nth level. When you click this button, you will be required to specify the depth of your selected entity.
- For example, if you are selecting the Department Category as your entity, when you select the Nth level and a depth of 1, your report will show a category in each column. If you decided to select a depth of 2, your report will show both categories and subcategories in your columns.
- Keep in mind, this option is not available for the most narrow selection. For example, if you select the Item Class, you will not be able to select an item to the Nth level because the item is the narrowest level you can go on the item entity.
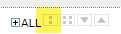
- Clicking the four dots next to an entity will automatically expand your select to the narrowest option. For example, if you select the Department Category entity, you will see every item within every category.
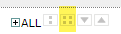
- Clicking the down arrow will add the top performing selections. For example, if you want to only have the top 5 categories in your columns, you will click the down arrow, then select 5. This will bring to top 5 categories into the columns of your report.
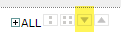
- Clicking the up arrow will add the lowest performing selections. For example, if you only want to have the bottom 5 categories in your columns, you will click the up arrow, then select 5. This will bring to bottom 5 categories into the columns of your report.
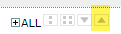
You can move any selected entity up or down the Selected Entities column by clicking the up and down arrows. You can remove a selected entity by clicking the red 'X' next to the entity.
Example:
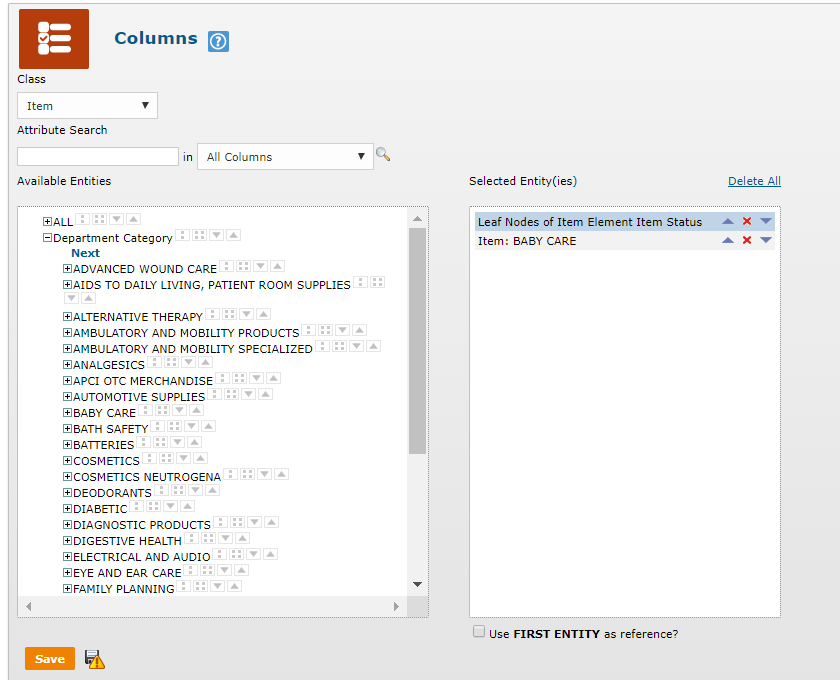
In the screenshot above, I selected the Item 'Class'. I then selected two different entities:
- Leaf Nodes of Item Element Item Status - I will see every item status in a different column.
- Item: Baby Care - I will see one column for the Baby Care category.
Keep in mind - the more columns you select, the longer your report may take. This will also be true for the Rows picker, mentioned below!
7. Rows - This picker works exactly like the Columns picker. Any entity that is selected in this picker will appear in the rows section of your report.
8. Pick any group that should be excluded (optional) - This picker allows you to exclude a certain group or entity from your report. Keep in mind, this picker does not work like the Columns and Rows pickers. Here, you cannot select Nth levels, leaf nodes, top or bottom entity selections. Additionally, only one option can be selected for this picker. You cannot select multiple entities.
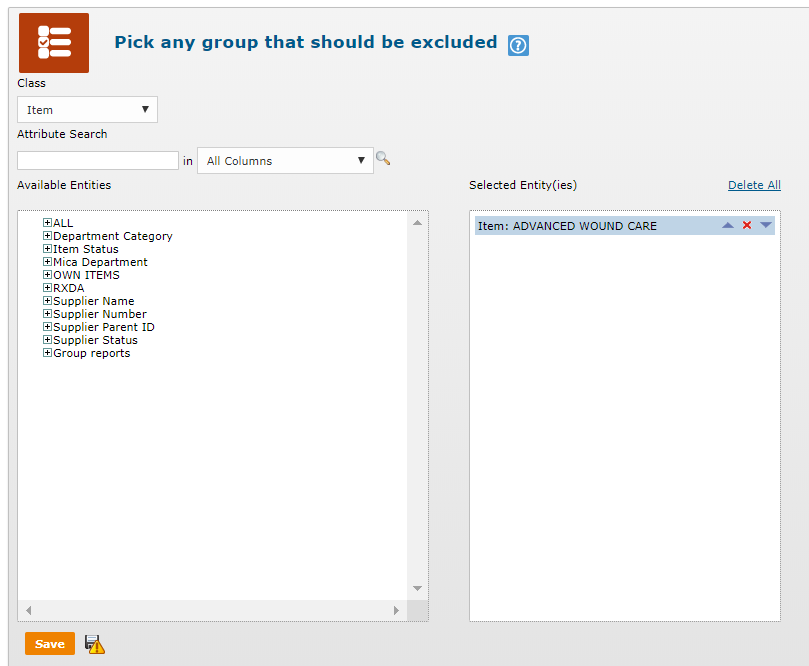
In the screenshot above, I chose to exclude the Advanced Wound Care category from my report.
9. Filter By (optional) - You can use this picker to narrow your search even more.
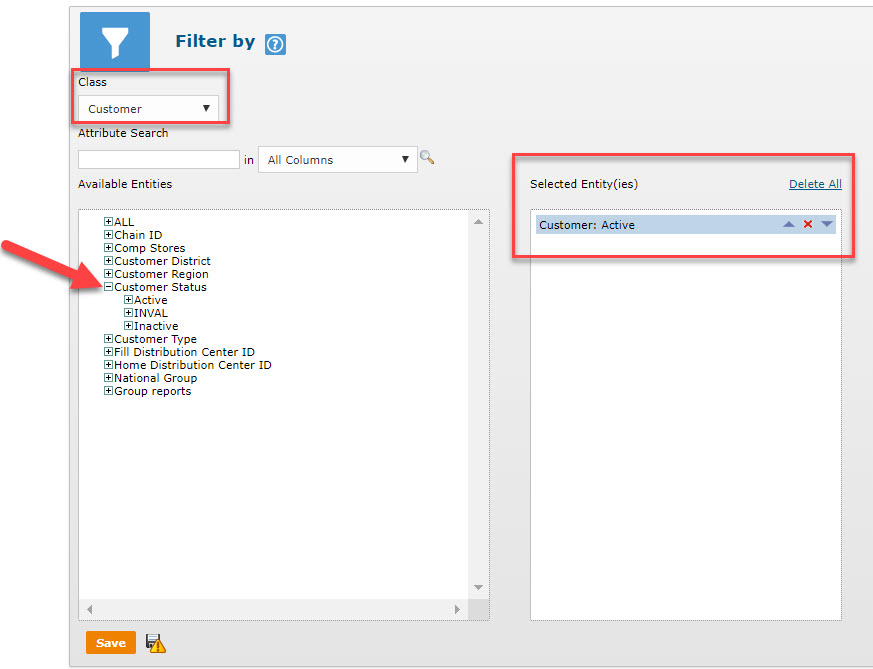
In the example above, I have selected the Customer 'Class'. Then I selected to only view customer's whose status is Active. Now, I will be running my report to analyze items purchased by Active customers.
10. AND Filter (optional) - You can use this picker to narrow your search even more. This picker works the same as the 'Filter By' picker and will require your dataset to meet both the Filter By criteria and the AND Filter criteria to be included in your report.
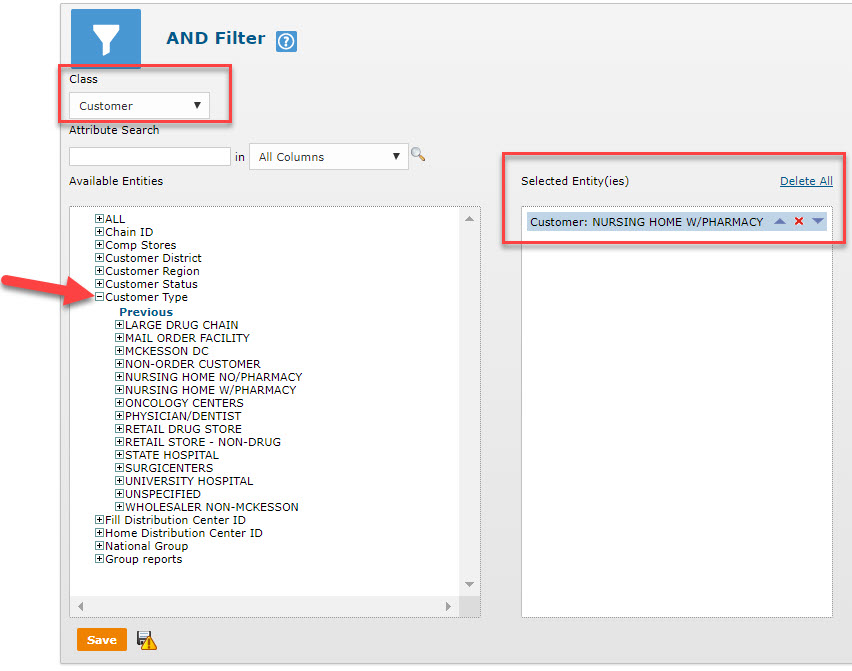
In the screenshot above, I have selected Nursing Home w/ Pharmacy. This means that my report will only pull sales data for items purchased by Active customers and are in the Nursing Home w/ Pharmacy customer type. If my item was purchased by an Active customer, but the customer is not a Nursing Home w/ Pharmacy, then the sales will not be counted.
11. Exclude (optional) - This picker allows you to exclude a certain group or entity from your report.
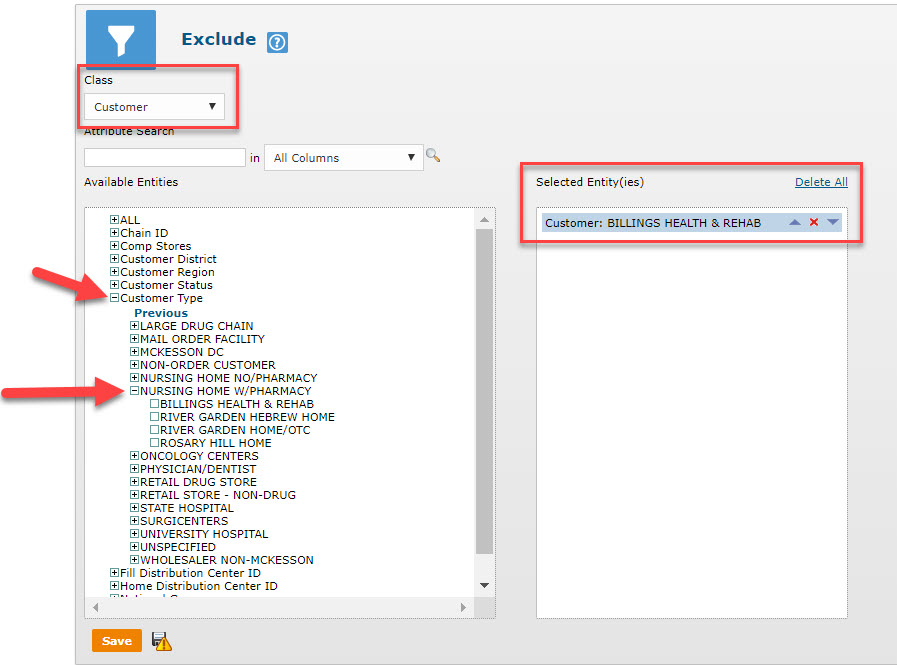
Continuing with the example above, I will be running my report on items purchased by Active customers, who are also part of the Nursing Home w/ Pharmacy customer type, but I am excluding the Billings Health & Rehab customer.
12. Report Options (optional) - This section allows you to customize your settings. For example, your report will automatically set the 'This Year' column header to 'TY'. You can update the column header to any header name you wish. It will also allow you to include rollups on your report. This will let you pull more data into your report once it runs. I recommend always enabling your rollups, just in case! View our article on understanding rollups here: Understanding Rollups.
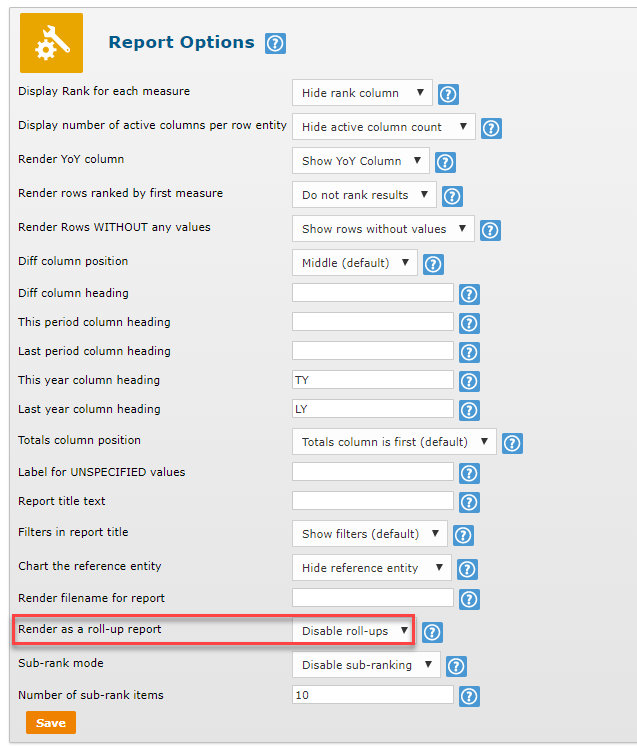
Once you have updated all your report options and pickers, you are ready to run your report.
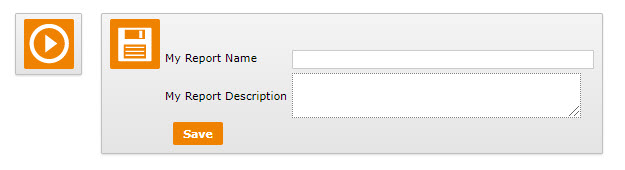
13. Run or Save Report - Click the Play button to run your report. Click the Save button to have your report saved as a custom report in the My Reports section of your Front End Insights portal. If you wish to Save your report, you will be required to enter a Report Name before saving your report.
While your report is loading, you will see a loading page like this:

Once your report has loaded, you will have the option to export your file as a CSV or Excel file.

To learn how to view a completed report, please view our article: Viewing a Completed Report.