Base Report Definitions
The system provides a large collection of base report types that you can run and view. Utilizing the report types will allow you to view different representations of the data in the form of tables and charts. The following section gives a description on each of the different report types.
Note: Your system administrator or site configuration determines the report types you can access. This means that some report types may not appear in your report menu.
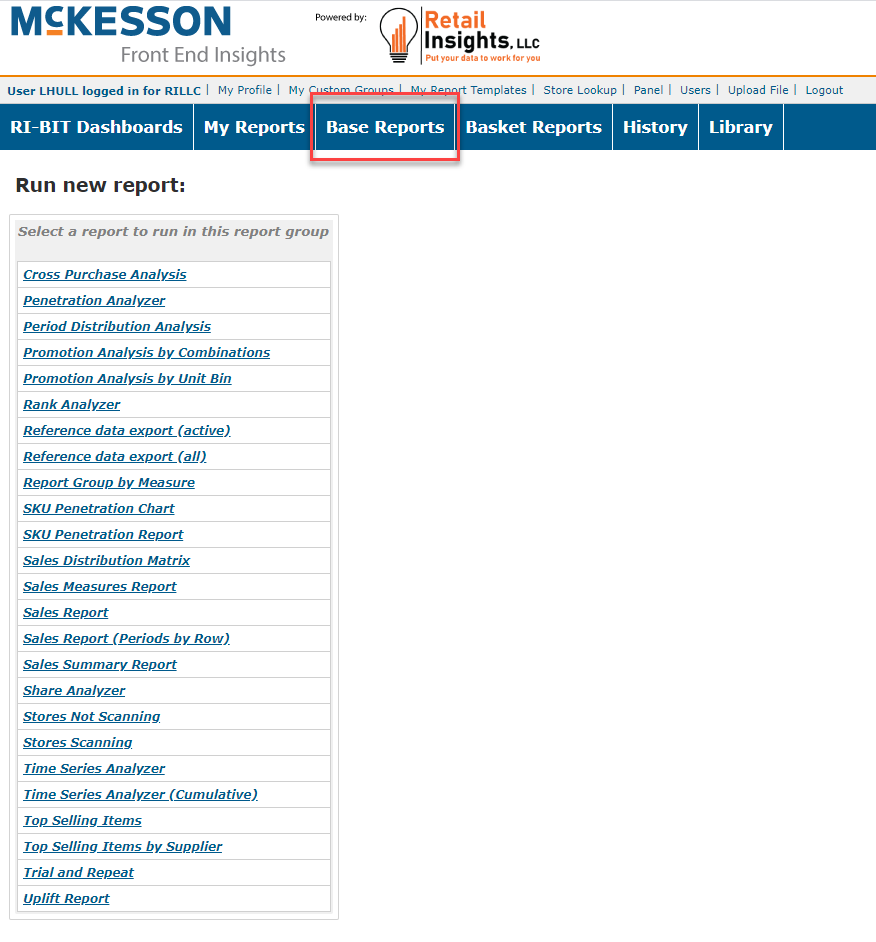

Cross Purchase Analysis
For this report, the user must select two sets of entities. One set is called the column entities (the first column entity is a reference entity), as these are rendered as column items in the tabular version of the report, and the other is called the row entities, as these are rendered as the row items in the tabular version of the report. The report essentially calculates the measures for each row entity across the column entities.
Note: This report is limited in the number of columns you can select for comparison. Do NOT try to run this on all the SKUs in a category, the report will error out. It is recommended to keep the columns you select to 15 or less.
Penetration Analyzer
This report evaluates the number of stores, called the Scanning Stores, which sold each Analyzed Item as a percentage of the stores which sold a Reference Item. The Analyzed Item can be a list of multiple items or item groups; the Reference Item is a single item or item group, and is rendered in the first row of the table. The report also calculates the size of prize, or opportunity gap associated with the non-selling stores. Size of Prize is a calculation defined as average dollars per scanning store, multiplied by total additional stores that could sell the item.
Period Distribution Analysis
This report was formally called the Core Range Adherence Report.
This report analyzes the distribution of the selected items or item groups across the selected stores for each period within the selected period range. The report shows, for each selected store and for each selected item, whether the item was distributed during each period within the selected period range, and calculates the size of prize associated with the periods for which there was no distribution. The report also provides a summary per store for all the selected items showing:
- Period distribution: Average distribution of the selected items per period
- Total average distribution: Total average distribution for all the periods for all the selected items
- Value of sales: Total sales value for the whole period range
- Size of prize: for 100%, 50% and 25% distribution
Promotion Analysis by Combinations
Promotion Analysis by Unit Bin
For this report, the user must select two sets of entities. One set is called the column entities (the first column entity is a reference entity), as these are rendered as column items in the tabular version of the report, and the other is called the row entities, as these are rendered as the row items in the tabular version of the report. The report essentially calculates the measures for each row entity across the column entities.
Rank Analyzer
This is a generic report that can be run on any entity or entity group within the reference data, e.g. items, stores/customers, regions, etc.
This report ranks a list of selected entities or entity groups for a selected list of measures. When multiple measures are selected, the global ranking is performed against the first measure in the list of selected measures.
The percentage growth period-on-period, and ranking for the previous period, are shown if the report is run for a period-on-period analysis.
Reference data export (active)
Export reference data for all active items in the given period.
Reference data export (all)
Export reference data for all items.
Report Group by Measure
Generate a group based on specific measures for a period.
SKU Penetration Chart
This report charts the number of purchasing stores which purchased the selected item, versus the total number of purchasing stores (i.e. the number of stores purchasing any item).
SKU Penetration Report
This report shows the number of purchasing stores and sales volume per period in the selected period range for a single selected item, compared with the same measures for all purchasing stores (i.e. the stores purchasing any item).
Sales Distribution Matrix
This report renders a matrix with a selection of entities as the rows versus a selection of entities as the columns, and calculates the selected measures for each combination. The period-on-period percentage changes of the measures are shown if period-on-period is selected.
This report can be used to construct a matrix of arbitrary row entities versus column entity measures.
Sales Measures Report
This summary report provides the year-on-year growth/shrinkage for the selected sales measures for any single entity or entity group.
Sales Report
This is a roll-up report which calculates, for each entity within the selected group(s), the selected measures for each of the selected periods. The year-on-year or period-on-period growth/shrinkage is also shown if this option is selected with the periods. The first entity in the list of selected entities can be specified as a reference entity, in which case the measures for each entity are shown as a percentage relative to the reference entity (relative entities MUST be selected in this case, e.g. Dollars %).
Sales Report (Periods by Row)
This is a roll-up report which calculates, for each entity within the selected group(s), the selected measures. The year-on-year or period-on-period growth/shrinkage is also shown if this option is selected with the periods. The first entity in the list of selected entities can be specified as a reference entity, in which case the measures for each entity are shown as a percentage relative to the reference entity (relative entities MUST be selected in this case, e.g. Dollars %).
Sales Summary Report
This sales summary report provides sales value and volume summaries for the current week-, quarter- and year-to-date for any selected entity or group of entities, with year-on-year comparisons.
Share Analyzer
This report calculates the selected entities' share of the selected reference entity on each selected measure. The report ranks the entities according to their share of the reference entity, and also renders the percentage change, share and share rank for the previous period when the period-on-period option is selected.
This report is most meaningful when it is run for a period-on-period analysis, in which case the performance of the ranked entities, in terms of period-on-period growth, relative to the reference entity is highlighted: the report highlights (in red) the ranked entities whose period-on-period growth is less than that of the reference entity, e.g. if a particular product's growth is less than the growth of a category, where the category is the reference entity.
Stores Not Scanning
This reports lists the stores not scanning during the specified time period.
Stores Scanning
This report summarizes store sales for a single period with optional period-on-period growth/shrinkage.
Time Series Analyzer
This report generates a time series chart (with tabular report) of the selected measures for the selected entities. The period group-by parameter determines the time series data points. This is a generic report that can be used to compute a time series analysis for any selected entities on any selected measures. The report also calculates the period-on-period difference, and plots the time series for the previous period if the period-on-period option is selected.
Time Series Analyzer (Cumulative)
This report generates a time series chart (with tabular report) of the selected measures for the selected entities. The period group-by parameter determines the time series data points. This is a generic report that can be used to compute a time series analysis for any selected entities on any selected measures. The report also calculates the period-on-period difference, and plots the time series for the previous period if the period-on-period option is selected.
Top Selling Items
This report will display and rank the top 10 items within every Category, which has been preselected for you based on the FIRST measure that you select. The report automatically ranks the top 10 items, and you cannot change that quantity.
Top Selling Items by Supplier
This report will display and rank the top 10 products for each supplier within each category. The report automatically ranks the top 10 supplier products, and you cannot change that quantity.
Trial and Repeat
Compare the customers purchase before, during and after a promotion.
Uplift Report
This is a report which calculates, for each entity, the selected measures for each of the selected periods, as well as the uplift for the measure, relative to the first period. The first entity in the list of selected entities can be specified as a reference entity, in which case the measures for each entity are shown as a percentage relative to the reference entity (relative measures MUST be selected in this case, e.g. Dollars %). Entities from different classes (eg Items and Stores) can be picked to see the effect of a promotion on a specific store/chain.